Why is my electric bill so high?

Understand exactly where your energy dollars go.

Get the Answers Your Utility Bill Never Provides

Plans starting at $9.99 / month

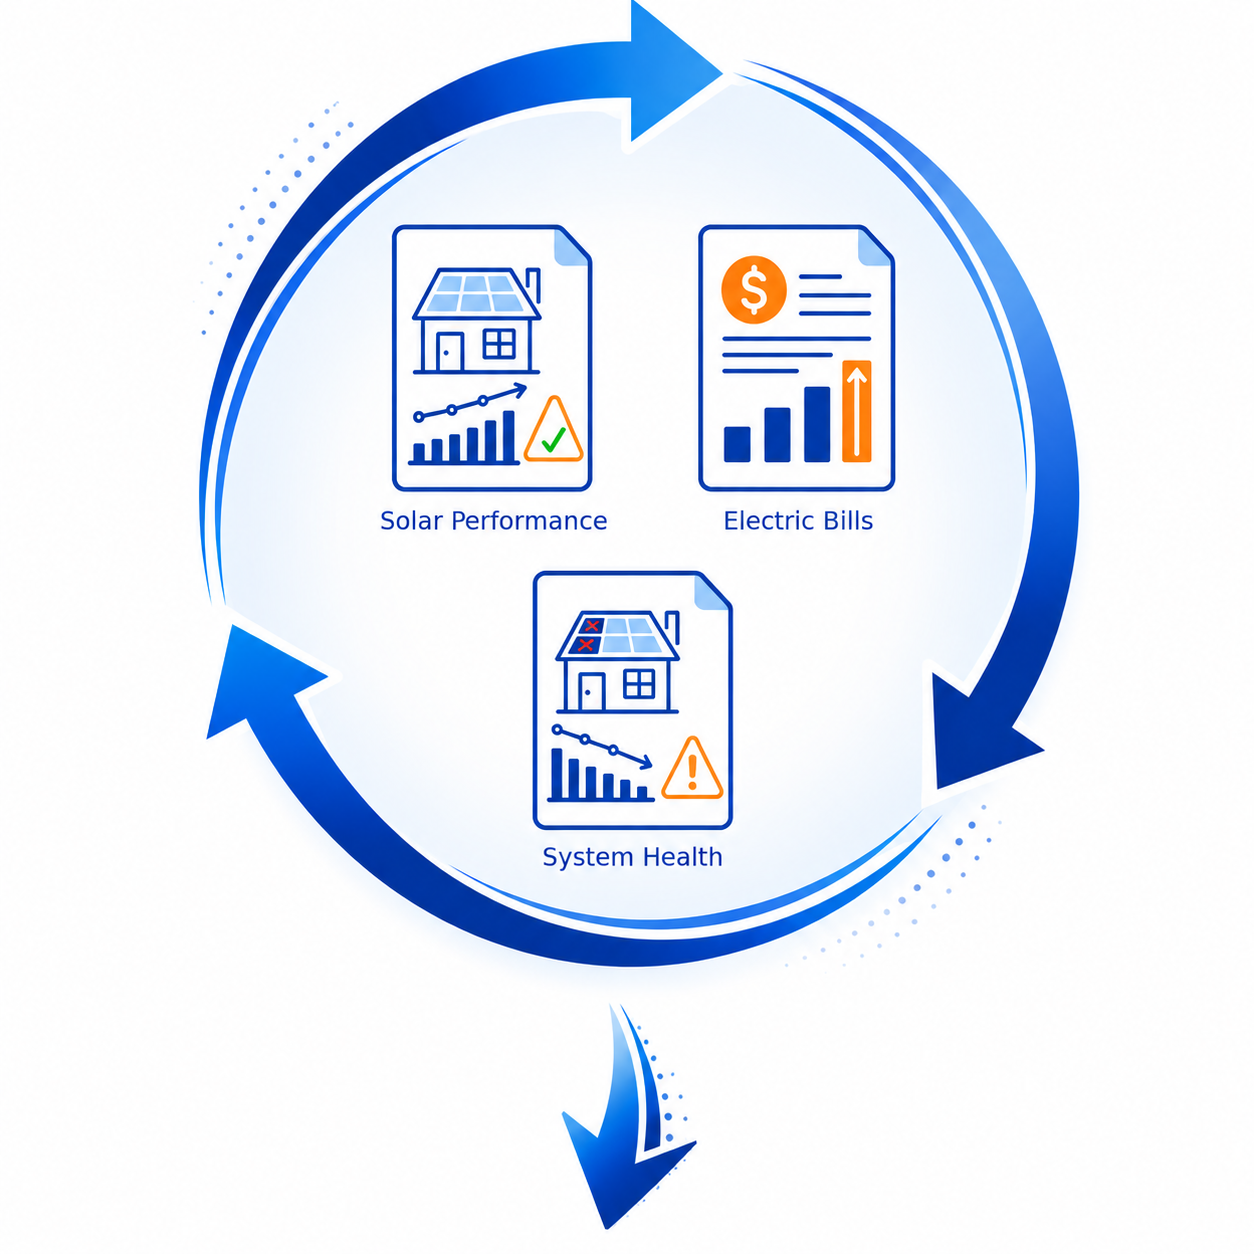
Understand your solar performance, electric bills, and system health- all in one place.
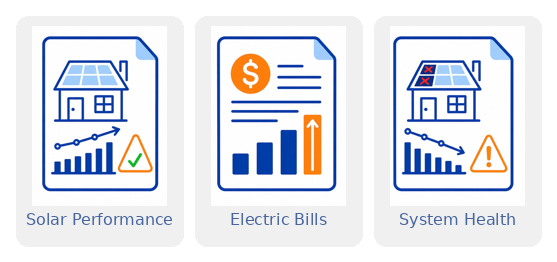
Solar Performance

Electric Bills
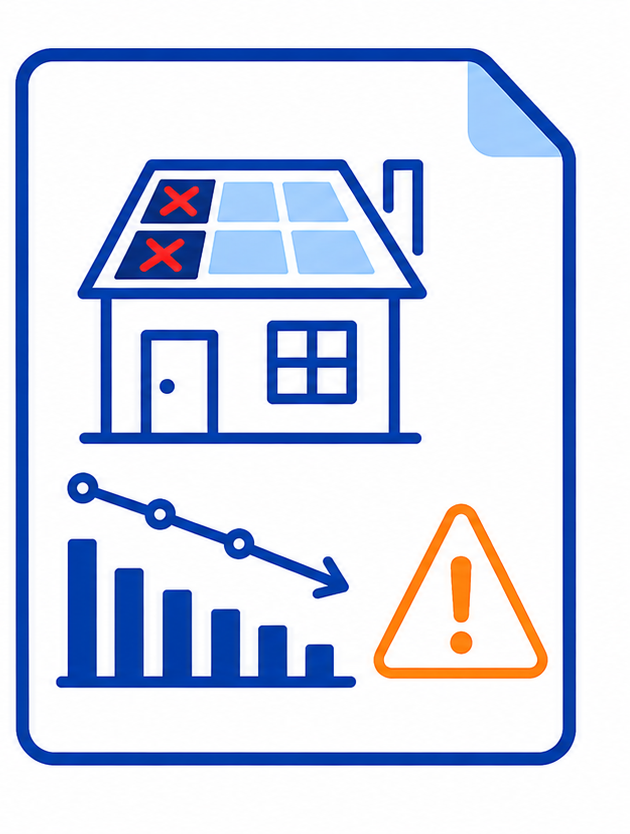
System Health

‍ ‍

MHER Living Report
My Home Energy Report
April 1 – April 30, 2024
456 Sunridge Drive, San Diego CA
You saved
$231
vs. estimated utility costs
Solar home energy flow
Used 18% less grid electricity than last month
System performing above forecast
24/7 monitoring active
Solar Offset
$156
TOU Savings
$52
YTD Savings
$1,847
Est. Annual Savings
$5,541
$234
Saved this month · April 2024
Solar Offset$156.00
TOU Off-Peak Savings$52.00
Net Metering Credit$26.00
YTD Savings$1,847
Lifetime Savings$8,420
Best Month
$312 · July
12-Mo Avg
$198/mo
Net Impact
☀️ = $234
1,033 kWhSolar Prod.
210 kWhGrid Used
Net Impact Detail
Solar Generated1,033 kWh
Home Consumed1,243 kWh
Grid Imported210 kWh
Savings Breakdown
Current Electric Bill$174.00
Bill Without Solar$408.00
Net Metering Credit$26.00
Total Savings$234.00
How We Calculate This
Off-peak rate$0.13/kWh
Mid-peak rate$0.27/kWh
On-peak rate$0.38/kWh
NEM export rate$0.12/kWh
Bill without solar$408
Actual bill$174
Where Your Energy Came From
1,243 kWh
Solar 1,033 kWh (83%)
Grid 210 kWh (17%)
Total 1,243 kWh
Energy Source Detail
Solar (direct)1,033 kWh · 83%
Grid import210 kWh · 17%
Solar exported to grid245 kWh
Export credit on bill$26.00
Solar self-consumption76%
Cost by Appliance
🚗 EV Charger
$84
🌊 Pool Pump
$60
❄️ AC high
$50
💡 Other
$75
Total appliance cost $269
Appliance Detail
EV Charger312 kWh · 31%
Pool Pump223 kWh · 22%
AC186 kWh · 18%
Other279 kWh · 27%
Time of Use Cost
Off-Peak
12–9 AM
$18
$0.13/kWh
Mid-Peak
9 AM–4 PM
$34
$0.27/kWh
On-Peak
4–9 PM
$66
$0.38/kWh
Super Off
9 PM–12 AM
$12
$0.10/kWh
Total TOU cost $130
Time of Use Detail
12–9 AM138 kWh · 25%
9 AM–4 PM126 kWh · 22%
4–9 PM174 kWh · 31%
9 PM–12 AM120 kWh · 22%
Want to Save More?
💡
On-peak usage cost you $66 this month
Shifting just 1.2 kWh/day to solar hours could save ~$15/month.
View recommendations →
Your Savings Action Plan
Check off what you want to tackle this month
Pre-cool your home 2–4 PM +$18/mo
Run AC during peak solar hours before 4 PM on-peak pricing kicks in. Your system generates maximum power at this time.
Shift pool pump to 10 AM–2 PM +$12/mo
Your pool pump ran 22% of total load. Moving it to mid-day runs it entirely on solar and avoids on-peak rates.
Charge EV overnight off-peak +$9/mo
EV charging after 9 PM drops to $0.10/kWh vs $0.38 on-peak. Schedule it in your car app or charge timer.
Enable battery discharge 4–9 PM +$6/mo
Battery is at 94%. Configure it to discharge during on-peak hours to eliminate grid draw entirely.
Clean solar panels +3–5% output
Light soiling detected. A quick rinse could recover up to 50 kWh/month at current production levels.
Total monthly opportunity +$45/mo
Your Average Daily Usage — by Appliance
EV Charger Pool Pump AC Other
Peak: 7PM-10PM
12 AM 6 AM 12 PM 6 PM 12 AM
My Home Energy Report
April 1 – April 30, 2024
456 Sunridge Drive, San Diego CA
You saved
$231
vs. estimated utility costs
Solar home
YTD Savings
$1,847
Est. Annual
$5,541
Net Impact
☀️=$234
Solar Generated1,033 kWh
Home Consumed1,243 kWh
Grid Imported210 kWh
Savings Breakdown
Current Electric Bill$174.00
Bill Without Solar$408.00
Net Metering Credit$26.00
Total Savings$234.00
Where Your Energy Came From
1,243kWh
Solar 1,033 kWh (83%)
Grid 210 kWh (17%)
Total 1,243 kWh
Cost by Appliance
🚗EV Charger$84
🌊Pool Pump$60
❄️AC$50
💡Other$75
Total appliance cost$269
Time of Use Cost
Off-Peak$18
Mid-Peak$34
On-Peak$66
Super Off$12
Total TOU cost$130
Your Savings Action Plan
Pre-cool home 2–4 PM +$18/mo
Run AC on peak solar before 4 PM on-peak pricing kicks in.
Shift pool pump to 10 AM–2 PM +$12/mo
Runs it entirely on solar and avoids on-peak rates.
Charge EV overnight off-peak +$9/mo
After 9 PM drops to $0.10/kWh vs $0.38 on-peak.
Battery discharge 4–9 PM +$6/mo
Battery at 94% — discharge on-peak to cut grid draw.
Clean solar panels +3–5%
Light soiling detected; a rinse recovers ~50 kWh/mo.
Total monthly opportunity+$45/mo
My Home Energy Report · Powered by DingoLink

What Solar Homeowners Are Saying

"I've had solar for 3 years and never knew if it was working right. My Home Energy Report flagged that my system was underperforming. Worth every penny."

— Mark T., Sacramento, CA

⭐⭐⭐⭐⭐

"Got an alert that my solar output dropped 22% — called my installer and they found a faulty inverter. The report paid for itself many times over in one month."

— Carlos V., Riverside, CA

⭐⭐⭐⭐⭐

"I'm not a tech person but this report makes sense. I know where my energy comes from, where it goes, and what I saved. $9.99 a month is nothing compared to the clarity it gives me."

— Susan H., San Diego, CA

⭐⭐⭐⭐⭐

Our Services

My Home Energy Report
$9.99 every month

Understand exactly where your energy dollars go. Monthly solar performance tracking, electric bill analysis, usage breakdown, and system health monitoring — all in one simple report. Independent 24/7 third-party monitoring you can trust.
Premium Home Energy Report | Phone Support & Warranty Help
$19.99 every month

Everything in our standard report plus expert phone support for manufacturer warranty claims. Independent 24/7 monitoring you can trust.

SunPower Homeowner Monitoring | Independent Solar Tracking
$29.99 every month

Lost your SunPower monitoring? Join the waitlist for independent system tracking and warranty support built specifically for SunPower homeowners.